
How Emissions Are Calculated
The calculation method behind every figure, including currency handling and its limits.
1. How a figure is calculated
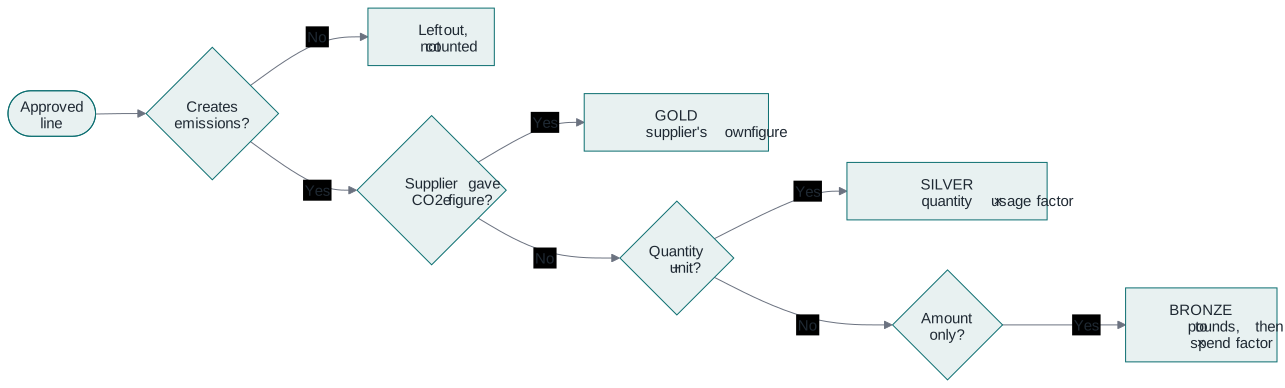
Every approved line item resolves to exactly one of three calculation tiers, and the tier is decided by the information you gave us about that line. The same information always produces the same tier and the same number, so any figure can be explained and repeated later.
- Gold — the supplier told us. Your supplier gave you a CO₂e figure on a certificate, and you passed it on to us. We use their number exactly as it is. Nothing is estimated.
- Silver — worked out from actual usage. You gave us a quantity and a unit (kWh, litres, kg, km). We match that against an official DEFRA figure for that activity. Because it is based on real usage, prices and exchange rates cannot affect it.
- Bronze — worked out from the amount spent. All we had was a sum of money. We apply an average for that type of spending. This is an estimate, and we label it as one.
Adding a quantity and unit to a line moves it from Bronze up to Silver and makes the figure noticeably better. Adding a supplier's own CO₂e figure moves it to Gold. Both are worth doing on the lines where you spend the most.
Some lines do not create emissions at all — moving money between your own accounts, for example. Those are marked as excluded and are not counted anywhere.
2. Currency conversion
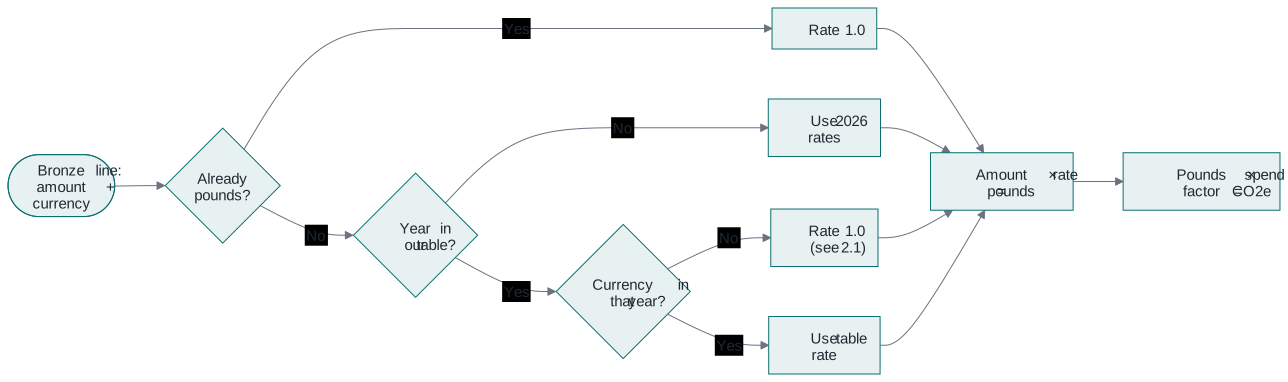
Currency only matters on the Bronze route, because that is the only one based on money. We convert the invoice amount into pounds before working out the emissions. Gold is already a CO₂e figure, and Silver is based on physical usage, so neither of them is affected by currency at all.
Pounds stay as they are, at a rate of 1.0. For other currencies, we pick the rate from a small fixed table based on the year of the invoice. If an invoice is dated in a year we do not have in the table, we use the 2026 rates.
| Year | USD to GBP | EUR to GBP | GBP |
|---|---|---|---|
| 2024 | 0.78 | 0.86 | 1.0 |
| 2025 | 0.79 | 0.85 | 1.0 |
| 2026 | 0.77 | 0.84 | 1.0 |
2.1 Currencies outside USD, EUR and GBP
If a currency is not in the table above, we treat one unit of it as one pound. If that currency is worth much less than a pound, the spending looks bigger than it really was, so the emissions on that line come out too high. If it is worth more than a pound, they come out too low.
This is a known limit of how the calculation works at the moment, not a fault with any particular figure. It only affects the Bronze route.
How to avoid it. Either of these removes the problem completely:
- Convert the amount into pounds yourself before uploading, and set the currency to GBP. Then the figure we receive is already right.
- Give us a quantity and a physical unit for the line instead. That moves it onto the Silver route, which is based on actual usage and never touches exchange rates.
How to find affected lines. We record the currency on every line we calculate. Download the audit trail for your reporting period and filter it for any currency that is not USD, EUR or GBP. Those are the lines this applies to.
When a line is calculated on this 1:1 basis, the explanation saved with that line now says so in plain words: that we hold no exchange rate for the currency, that the amount was treated as pounds and not converted, and that the figure is probably wrong. There is not yet a separate marker that stops approval or shows in the review list, so filtering the audit trail as described above is still the reliable way to spot these lines.
3. No inflation or price adjustment
This is another known limit of the method. We are setting it out here so it is not mistaken for an error.
What we do. We convert your spending into pounds using the invoice year's rate, then multiply by the spend factor. We do not make any adjustment for inflation between the year you spent the money and the year the emission factor was worked out.
Why this matters. A spend-based factor means "this much CO₂e for every pound spent" — but pounds as they were in the year that factor was created. If you spent your money in a noticeably different year, the same real purchase turns into a different number of pounds, and so into a different emissions figure. Because prices generally rise over time, spending from a later year measured against an older factor usually comes out too high.
Who this affects. Bronze lines only. Gold uses your supplier's own figure and Silver uses physical usage, so neither is touched by price levels. The best way to reduce how much this affects you is to give quantities and units wherever a line describes something you can actually measure.
4. The publish gate
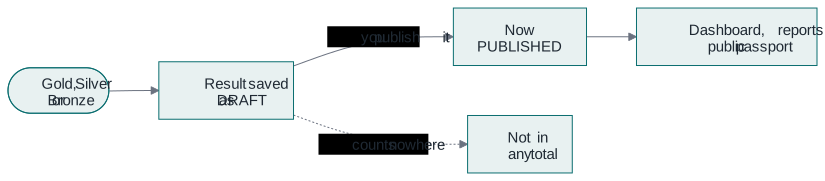
New results start life as drafts. A draft shows up nowhere at all: not in your dashboard totals, not in your reports, and not on any link you have shared. It only becomes a reported figure when someone with permission publishes it.
This is on purpose. It stops half-checked data from moving a number that someone else is relying on. If your dashboard still shows zero after you have run a calculation, the usual reason is simply that the results are still drafts.
5. Correcting a figure after it has been published
Publishing is not final, and there is no separate "undo" button to learn. You correct a published figure simply by correcting the line it came from.
Once a figure is published, we protect it from being changed by accident: if the calculation runs again and nothing about the line has changed, we leave the figure exactly as it is. That is what stops a routine re-run quietly shifting your reported numbers.
But if you actually edit the line, something has changed, so we work it out again. It stays published, and we keep a record of who published it originally and when. The figure updates where it stands and your dashboard total moves with it. The line is never quietly dropped from your total, and your correction never falls back into draft where you might not notice it.
How to do it:
- Find the line in Review and correct it — the category, the amount, the quantity and unit, or a supplier's own CO₂e figure.
- Run the calculation again. Only the lines you actually changed are worked out again.
- Your corrected figure replaces the old one in your published total.
Removing a figure completely. Deleting the original document removes its line items and their emission records at the same time, published ones included, and your totals drop to match.
Periods that have been closed. Once a reporting period has been locked, we refuse any edit to a line dated inside it before any recalculation can happen. That is deliberate: once a period has been signed off, the figures behind it stop moving. Only an administrator can reopen a locked period.
Every edit is recorded against the line: the old value, the new value, who changed it and when. So a corrected figure always shows both what it is now and what it used to be — which is exactly what an auditor will want to see.