
Get Started Guide
How to set up your account, get data in, and generate your first Carbon Passport report.
1. What Carbon Passport does
You send us your invoices, bills or a spreadsheet of your spending, and the platform turns it into a shareable Carbon Passport report. Here is how it works, stage by stage:

- Getting data in. There are three ways to do this: upload an invoice, upload a spreadsheet, or connect your accounting software and let it send data over automatically. Whichever route it takes, the result is a list of spending lines.
- Sorting it. Every line gets put into a category. Fixed rules go first — your own account codes, supplier rules your company has set, suppliers or descriptions we recognise, product codes. An AI is only asked when every rule has failed, and even then it only suggests.
- Checking it. Nothing is calculated until a person approves it. You confirm or correct the supplier, category, amount and quantity on each line.
- Calculating it. Approved lines are turned into kg CO₂e. Each one gets one of three quality tiers, depending on what information you gave us.
- Publishing it. Results start as drafts and count towards nothing. Publishing is a deliberate step that moves them into your reported footprint.
2. Account setup and roles
Your organisation and first admin account are created for you during onboarding. You will receive a sign-in link and a temporary password through a secure link that expires. Sign in, set your own password, and turn on two-step login, which is required on every account.
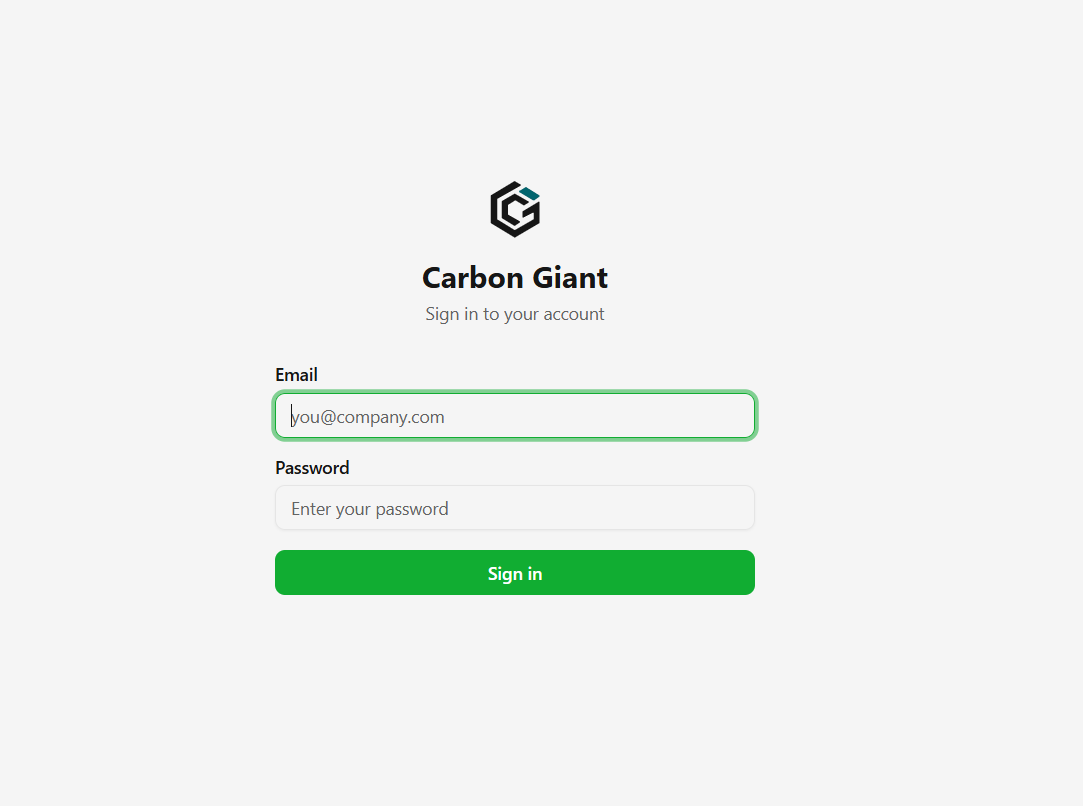
Step 1. Sign in.
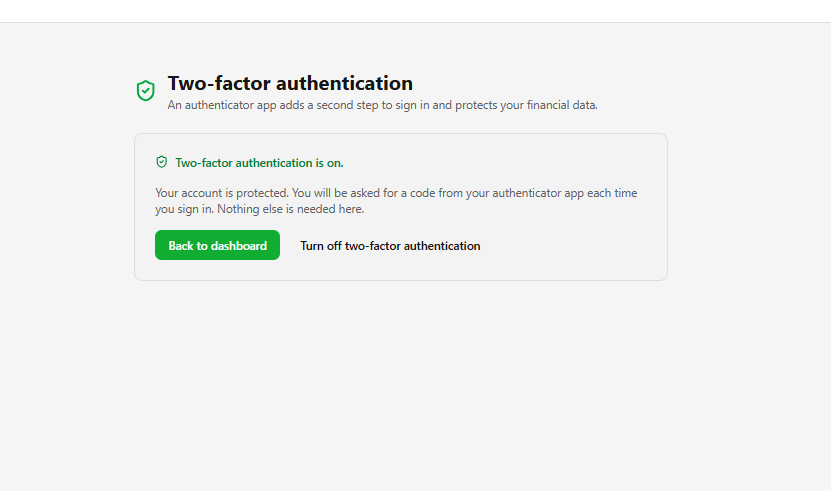
Step 2. Turn on two-step login. Every account has to enrol. Once it is on, you are asked for a code from your authenticator app on every sign-in.
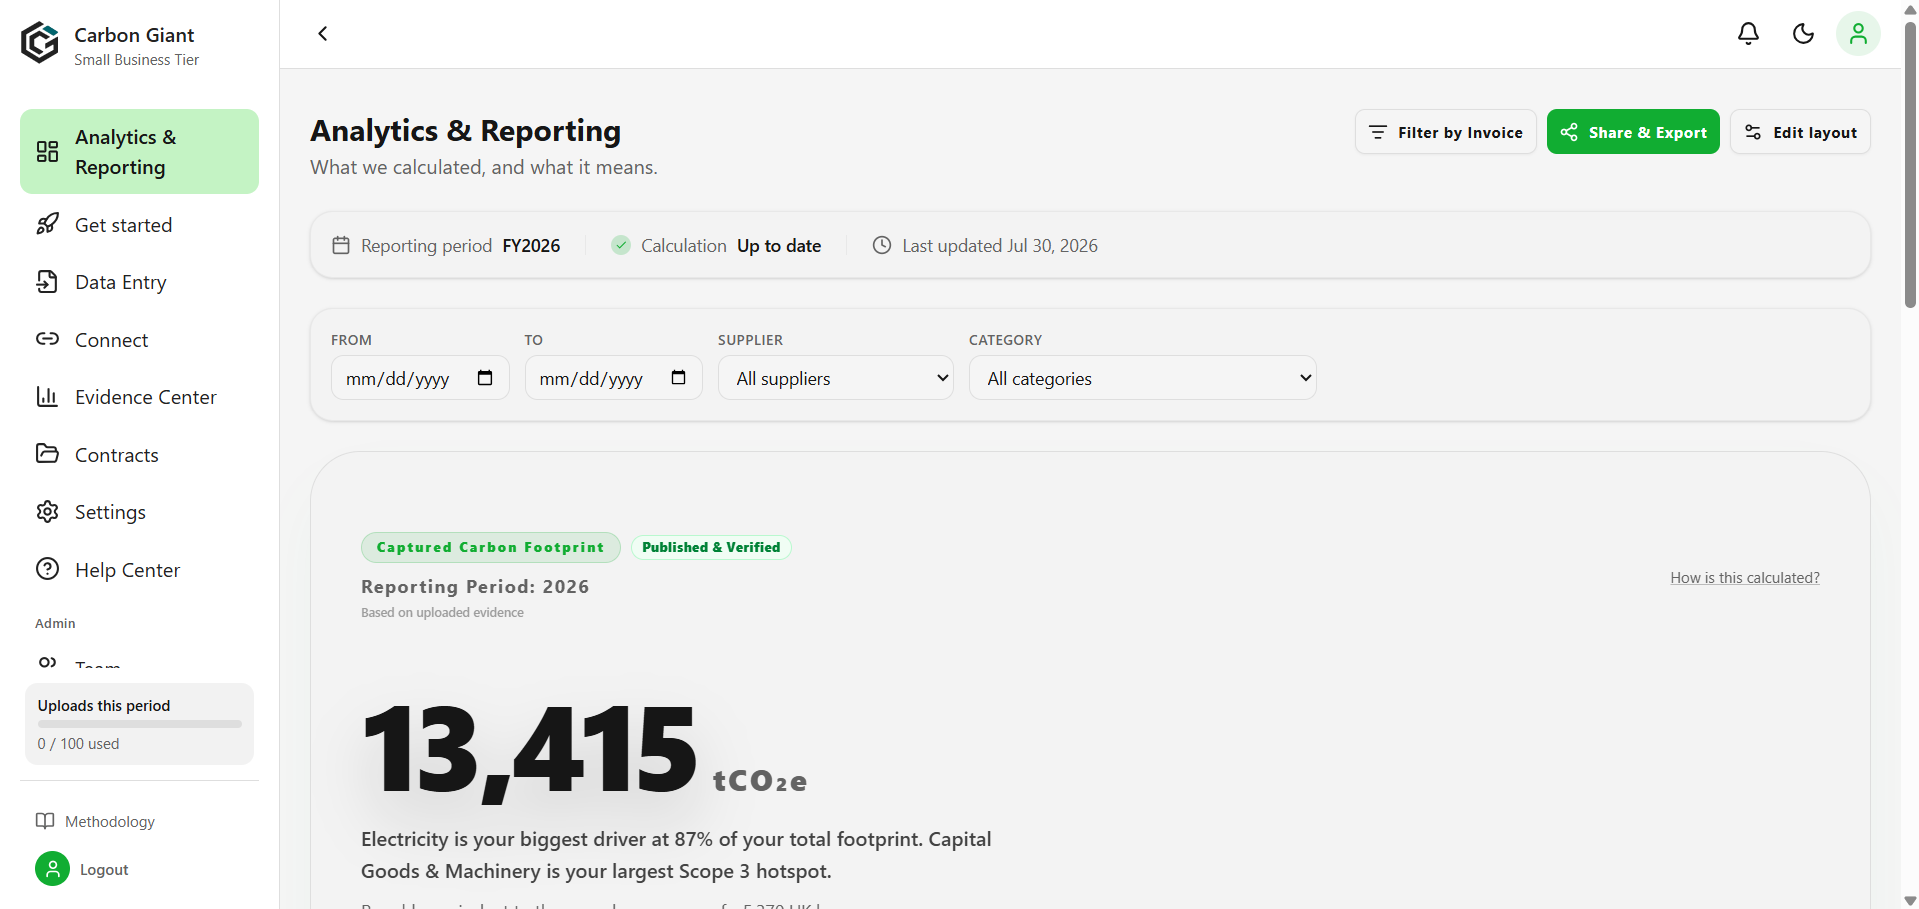
Once you are in, you land on your dashboard: the reporting period, whether the calculation is up to date, and your captured footprint for the period.
Step 3. Your dashboard.
Step 4. Set your company details. Under Settings you set your organisation name, logo, and the supplier and methods notes an auditor may need. This is also where your account tier is shown.
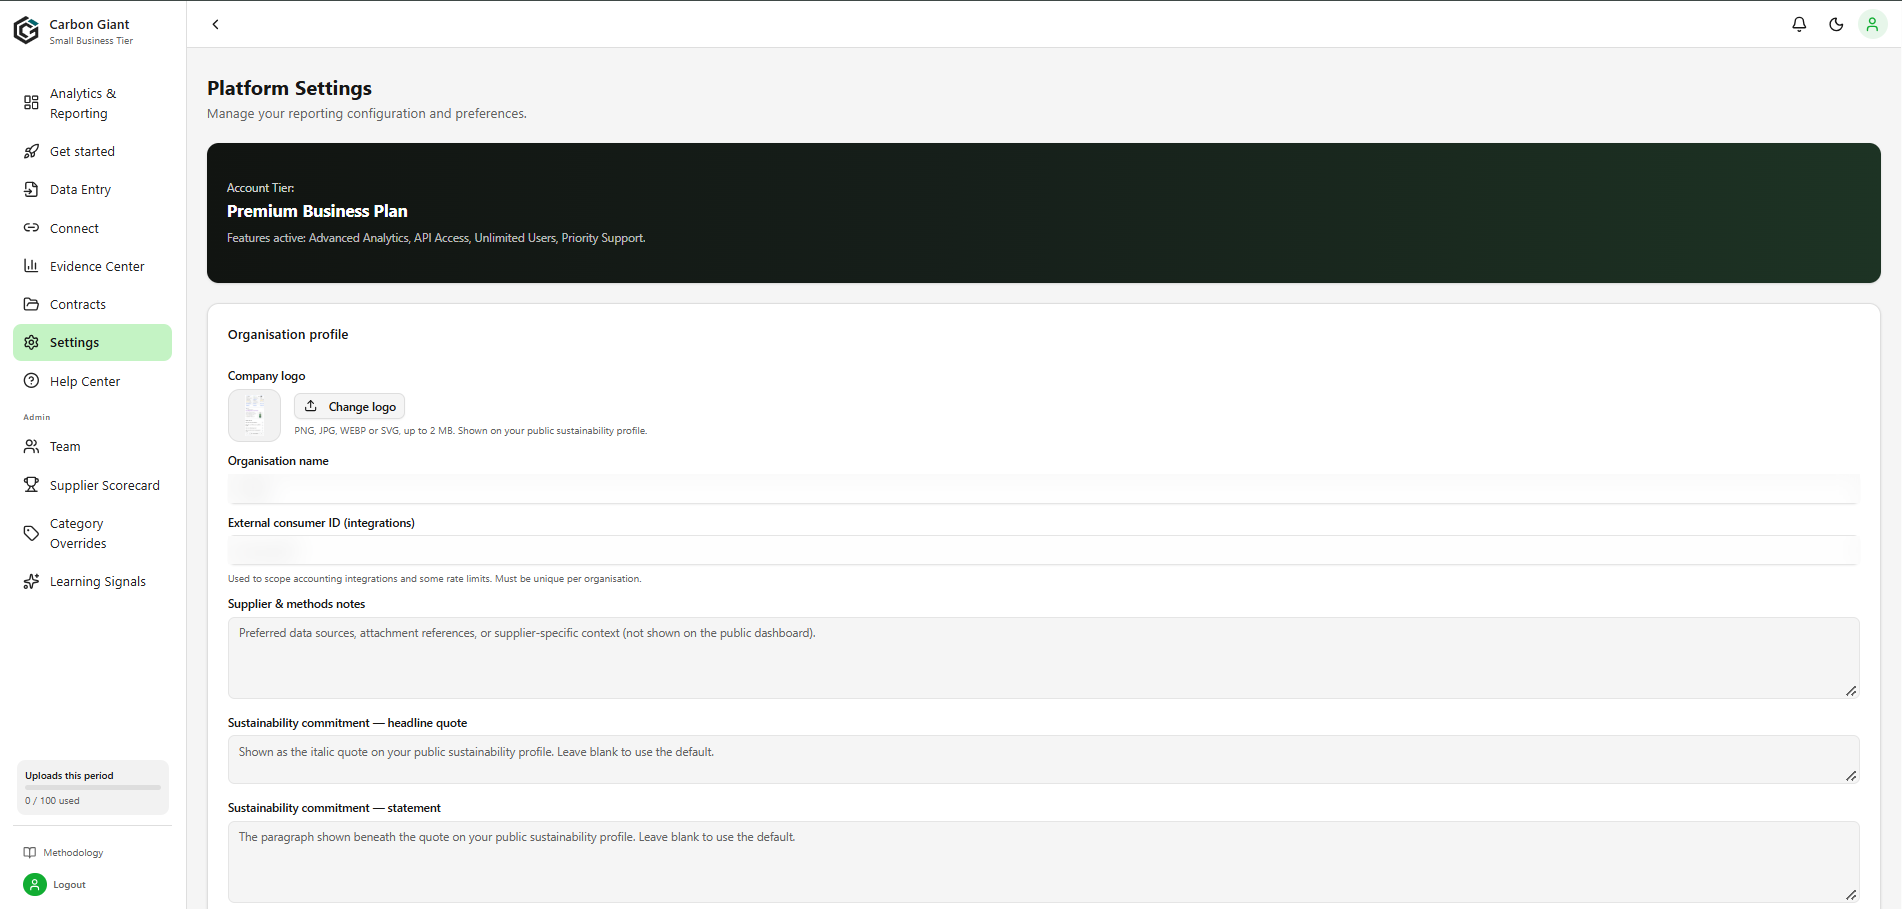
Step 5. Set your emission scopes. Further down the same Settings page, set the company type: a large unquoted company or LLP reports UK Scope 1 and 2, a quoted company reports global Scope 1, 2 and material Scope 3. This sets the SECR boundary used across your reports.
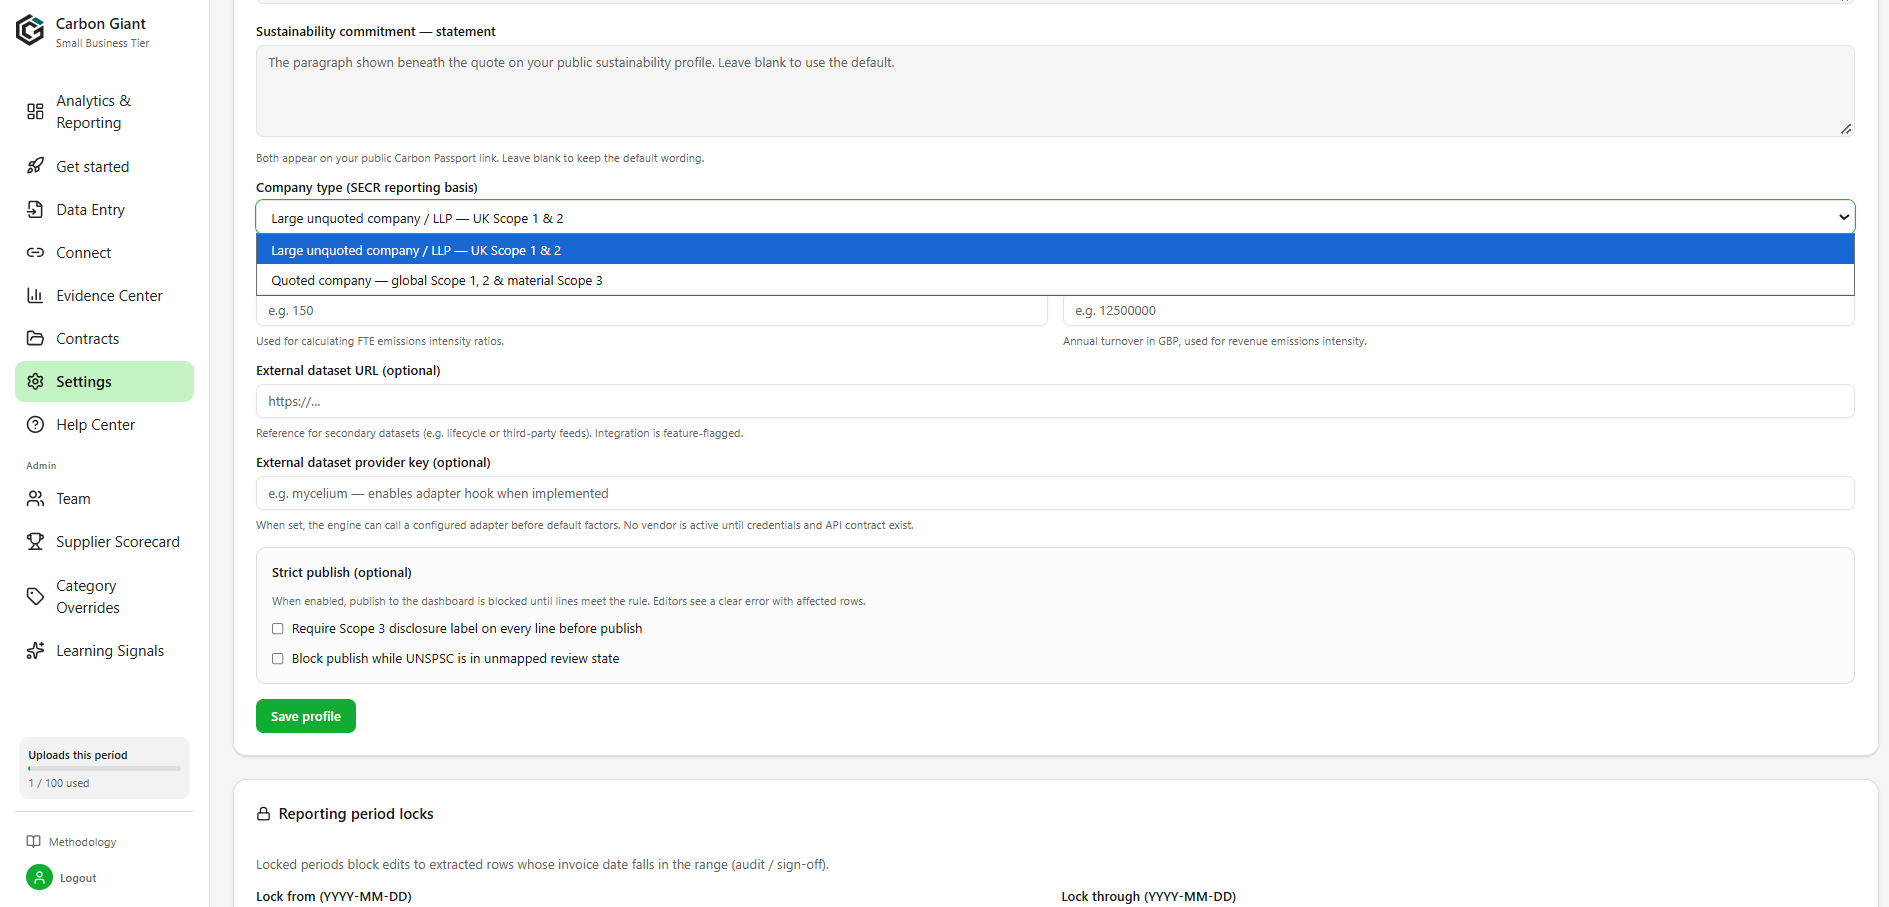
Your admin can then invite colleagues. Each person is given a role, set separately for each company.
| Role | Can do | Cannot do |
|---|---|---|
| Org Admin | Everything below, plus managing people, publishing results and deleting data | — |
| Org Editor | Upload documents, connect accounting software, check and correct lines, run calculations | Manage people, delete the company |
| Org Viewer | Look at dashboards, reports and published results | Upload, edit, approve, calculate or publish |
Give people the smallest role that still lets them do their job. Someone who only needs to see the numbers should be a Viewer.
3. Getting your data in — three ways
Select the method that best fits how your data already exists.
| Route | Best for | What you give us | What happens next |
|---|---|---|---|
| Upload an invoice | Individual bills and supporting documents | Upload a PDF or image file. You can add a hint about the type of spending if you know it | Your file enters the processing queue. The status moves from Pending to Processing to Completed, then the lines appear for you to check |
| Upload a spreadsheet | Lots of past spending at once, or an export from a system we do not connect to | A CSV or Excel file, one row per line of spending, with the header row kept | Every row becomes a line for you to check straight away. There is no reading step needed |
| Connect your accounting software | Ongoing data with nothing to do by hand | A guided sign-in to Xero, QuickBooks or Sage | Your bills and suppliers come across automatically as lines. You can run it again whenever you like |
A. Uploading an invoice
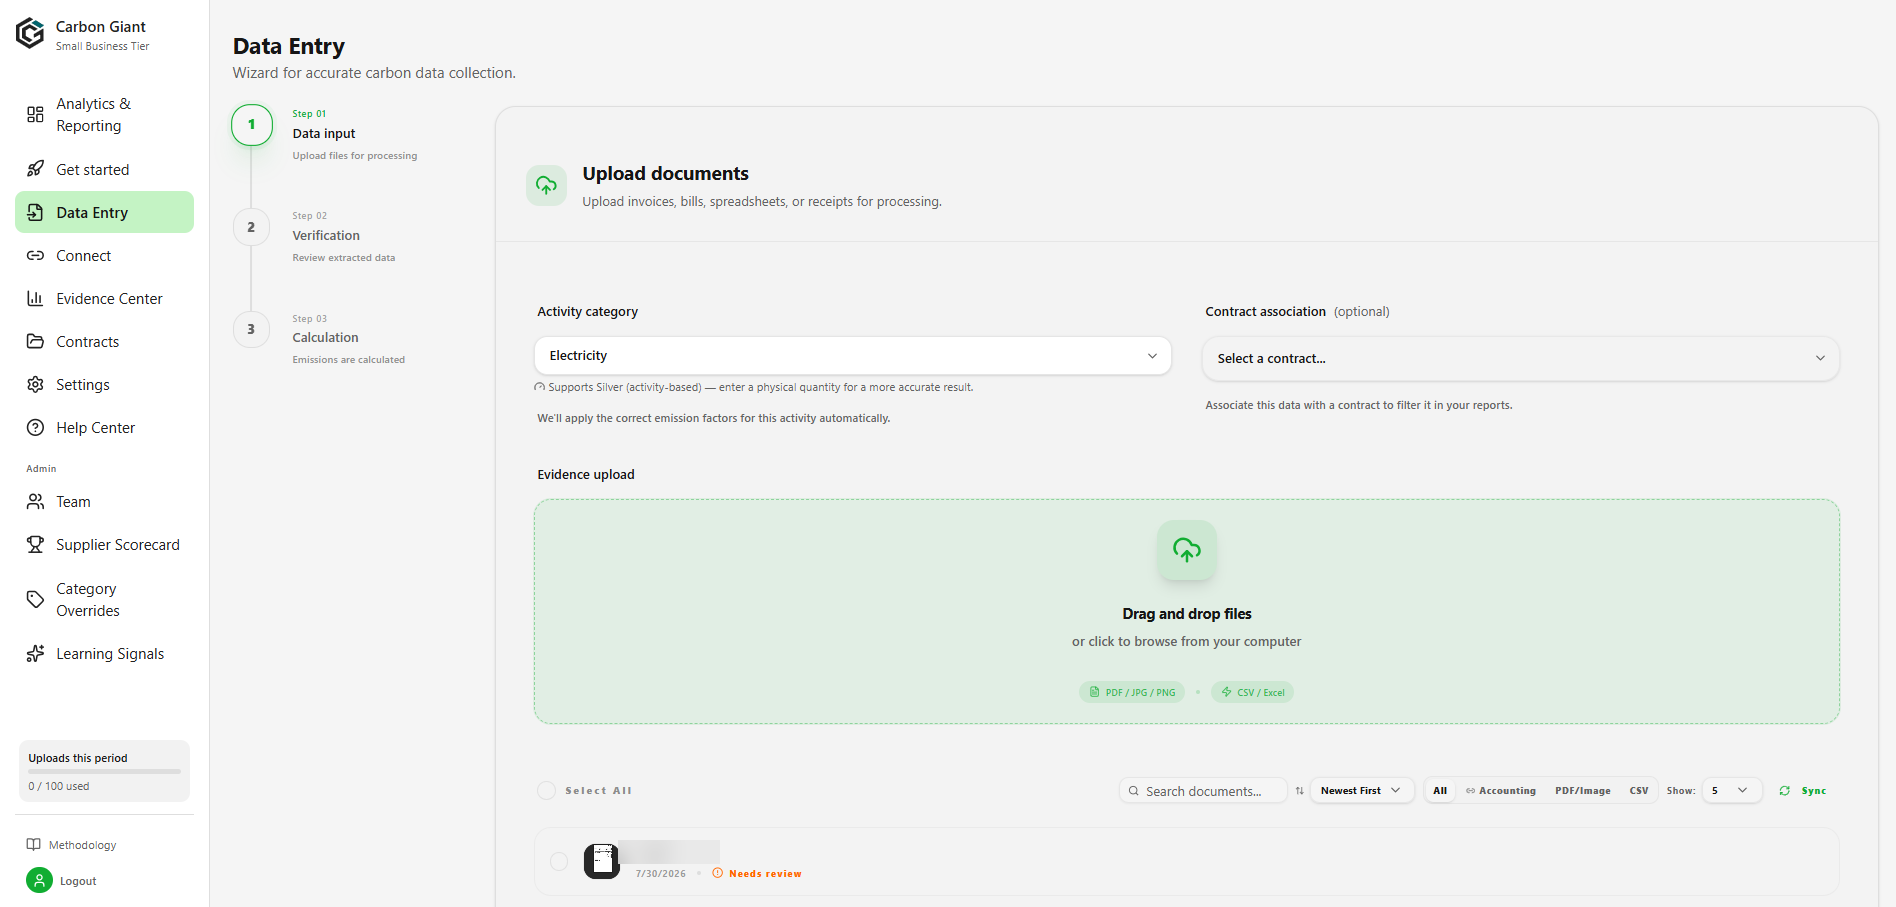
Step 1. Open Data Entry. This is the upload wizard: choose an activity category, optionally associate the upload with a contract, and drop your files in.
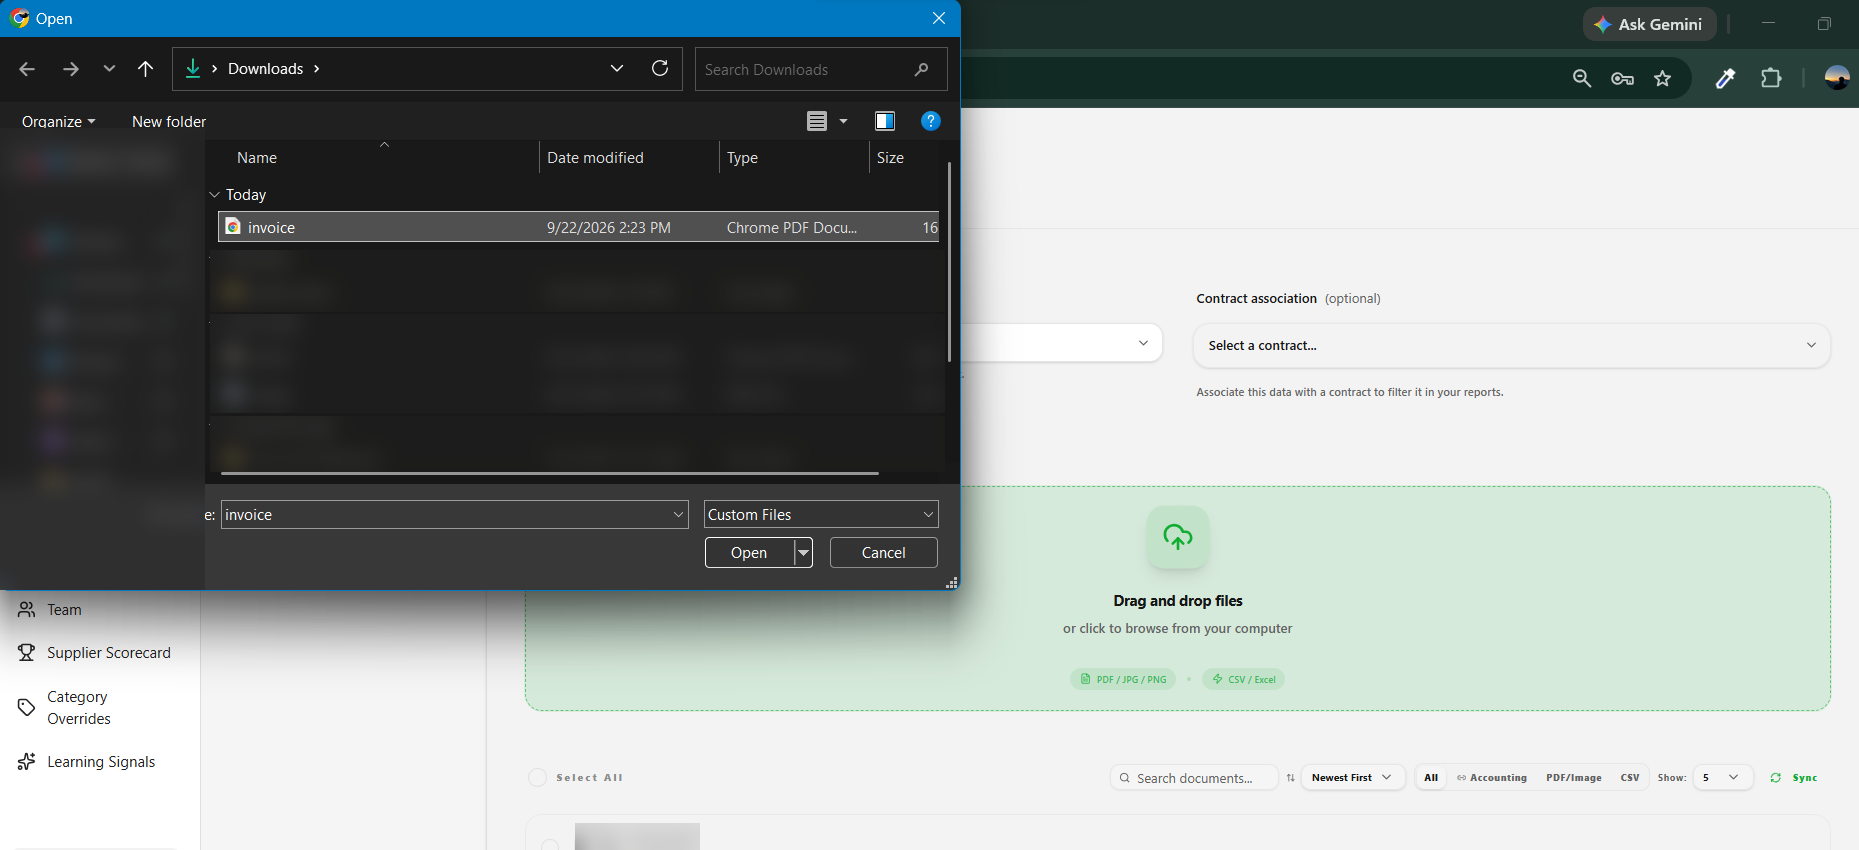
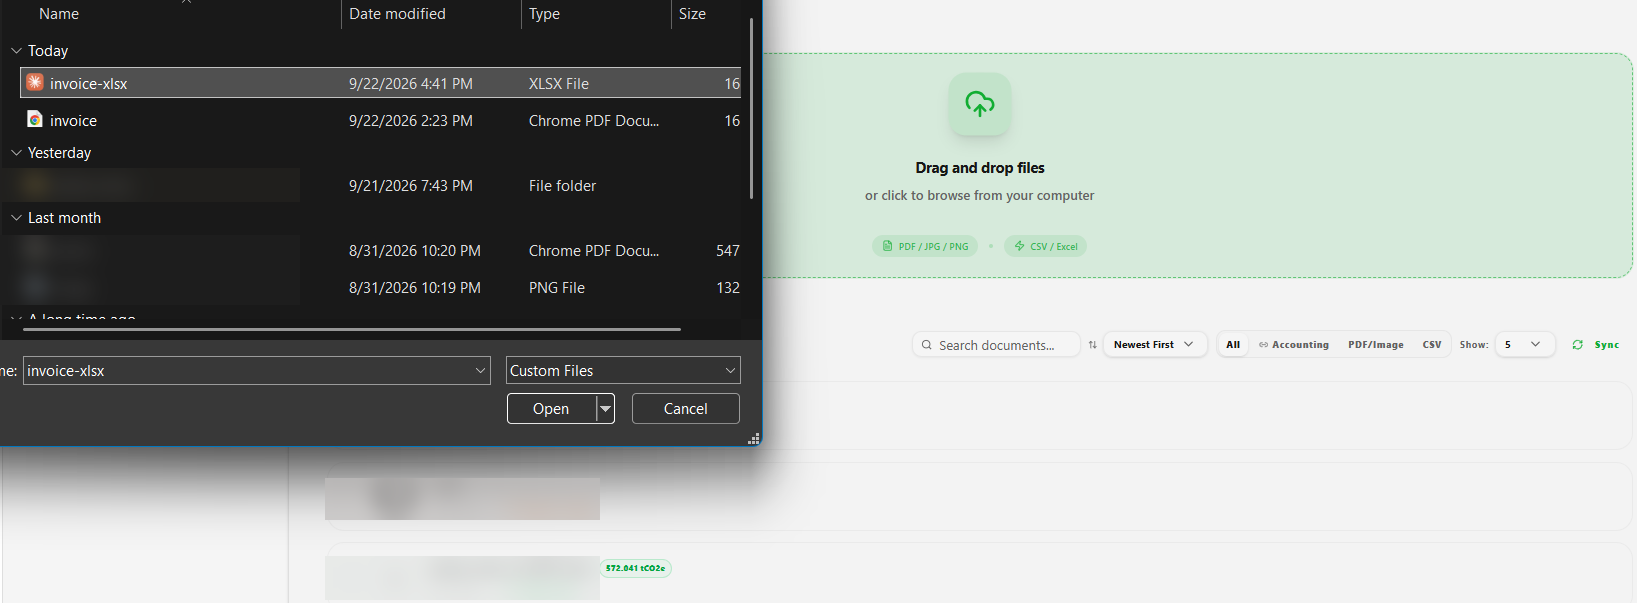
Step 2. Choose an invoice file from your computer. Click into the drop zone and pick the file, or drag it in directly.
Step 3. Check the document list. The list below the upload box shows what has already gone in and its status: needs review, or approved with its calculated total.
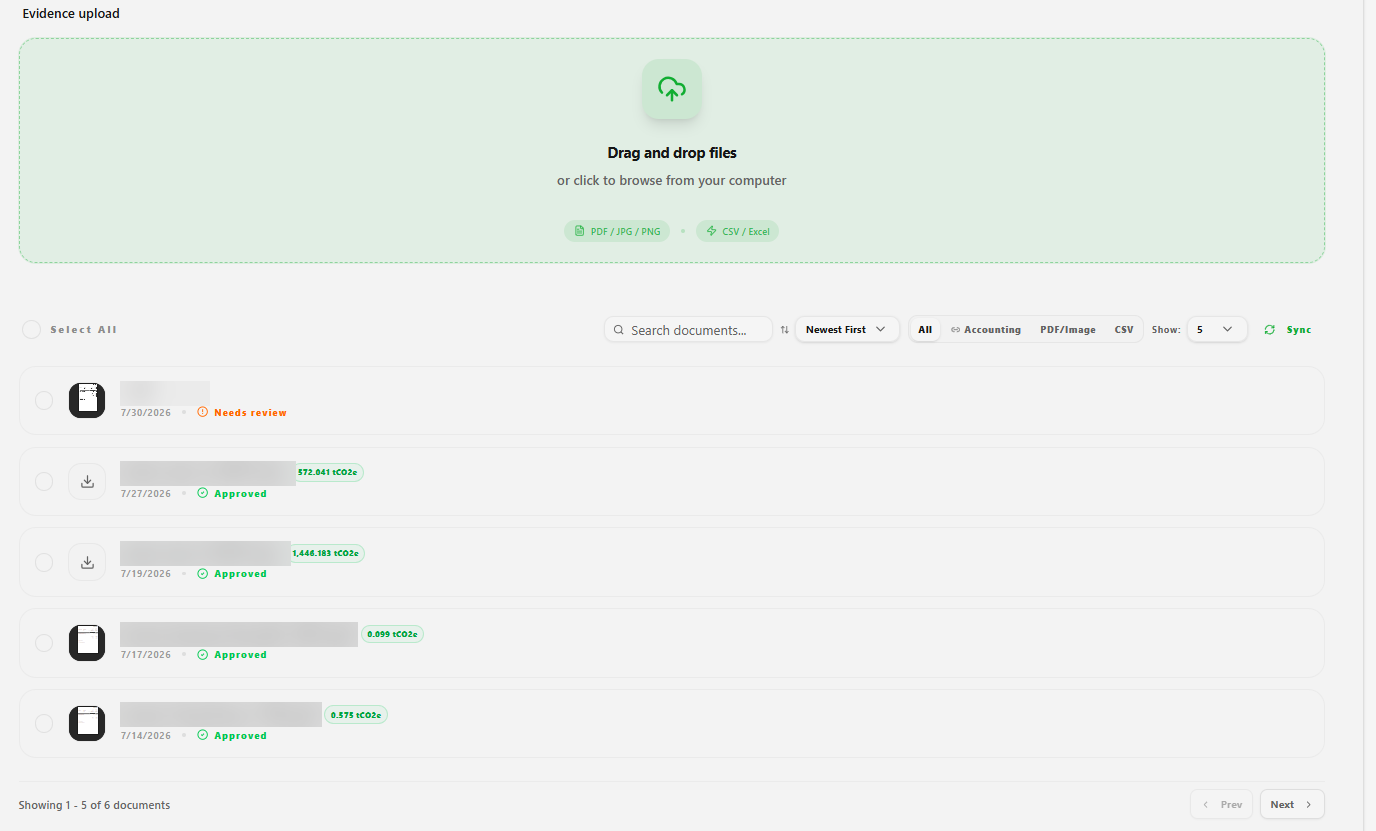
B. Uploading a spreadsheet
Start from our template — the Import Template Spec explains every column. Keep the header row at the top, and use one row per line of spending.
Step 1. Open Data Entry. The same upload wizard as the invoice route — choose an activity category and drop your file in.
Step 2. Choose a spreadsheet file from your computer. The same drop zone accepts CSV and Excel files. Here the file picker has a `.xlsx` file selected — it lands in the same document list as an invoice upload.
C. Connecting your accounting software
The connection can only read, never write, and you can disconnect it at any time. Disconnecting withdraws our access at the accounting platform itself.
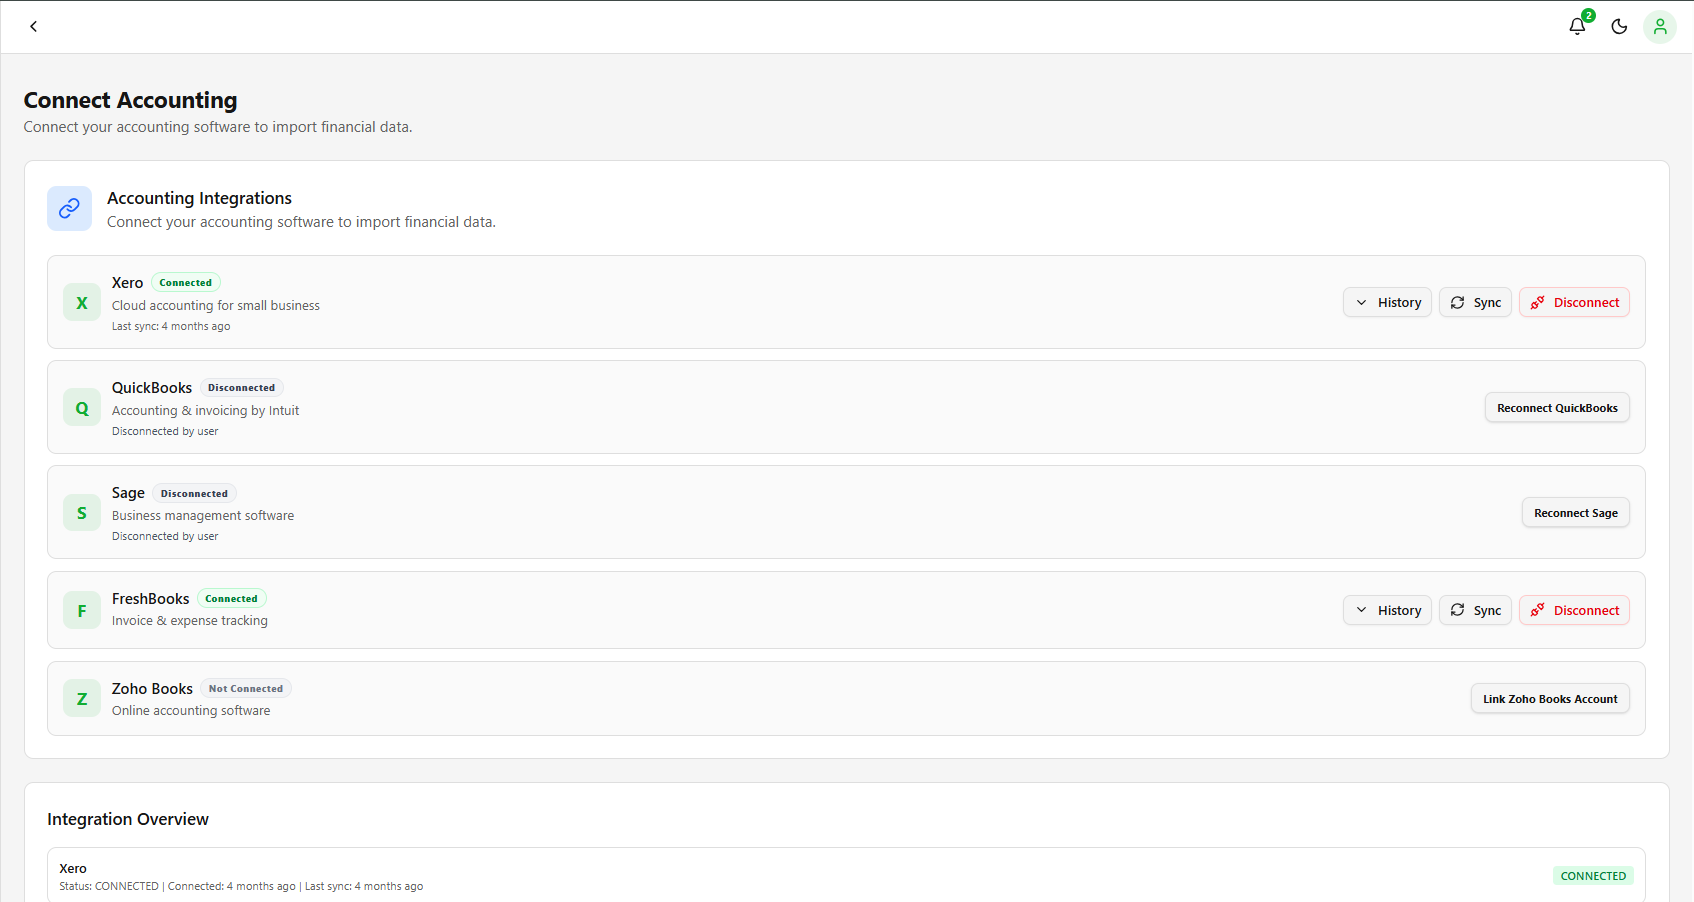
Step 1. Connect your accounting software. This is the Connect page — Xero, QuickBooks, Sage and the rest. Each card shows whether it is currently connected, when it last synced, and lets you sync, reconnect or disconnect.
4. Review & approve
New lines start as Pending Review. We only calculate emissions after you have approved them.
- Go to Data Entry / Review.
- For each row, check the supplier, category and amount, plus the quantity and unit if there is one.
- Correct the category if it is wrong. If a supplier has given you their own CO₂e figure on a certificate, add it here for the most accurate result possible. You can also pin a specific emission factor if you need to.
- Fix anything flagged up — the Error & Validation Guide explains every message.
- Approve the rows.
Step 1. Check the extracted line. Here is a real example: a SuperStore invoice for a "Barricks Round Table, with Bottom Storage" comes back as one line, with the supplier, description, date, total and quantity already filled in, and a status of Pending review until someone checks it.
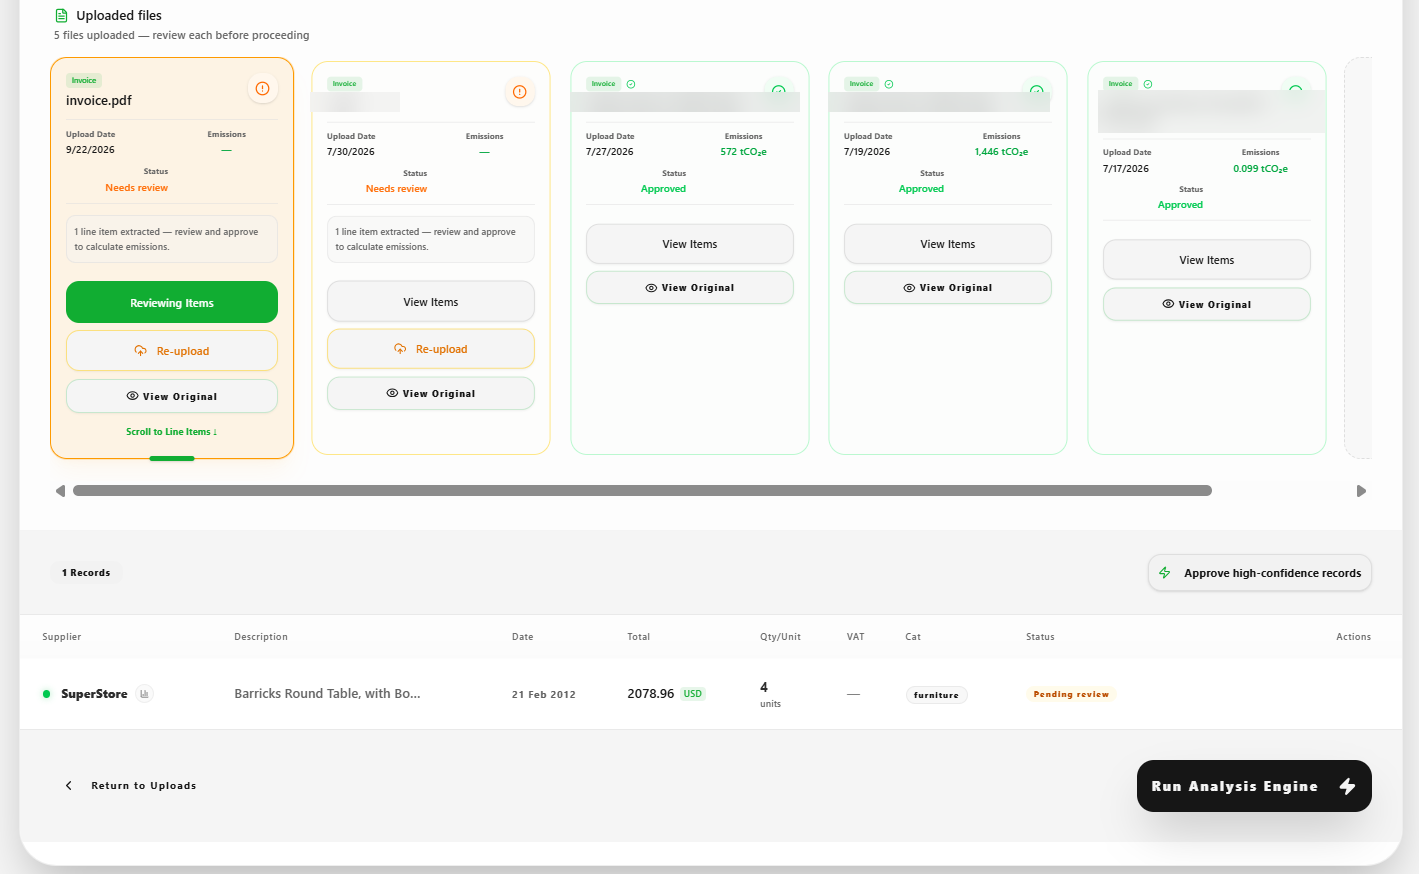
Identifying anomalies. The orange "Needs review" flag above is the anomaly signal — not a separate screen. A row carrying it, whether from OCR uncertainty, a missing field or a validation error, is excluded from calculation until someone resolves it. The Error & Validation Guide lists every flag and its fix, and the Evidence Center (Section 5, Step 3) shows the same signal in aggregate across every line you have processed.
5. Calculate, and the three quality tiers
Run the carbon engine. Every approved line item gets exactly one tier, determined by the information you gave us.
Gold — your supplier told you. You gave us a CO₂e figure from the supplier's own certificate. We use it exactly as it is, with nothing estimated. This is the most accurate result there is, and it is worth chasing your biggest suppliers for it.
Silver — based on actual usage. You gave us a quantity and a unit: kWh, litres, kg, km. We work it out from real usage against an official UK government figure (DEFRA). Accurate, and never affected by prices or exchange rates.
Bronze — based on the amount spent. All we had was a sum of money, so we apply an average for that type of spending. This is an estimate, and we label it as one.
What this means in practice: adding a quantity and unit to a line moves it from Bronze up to Silver and makes the figure noticeably better. Adding a supplier's own figure moves it to Gold. Both are worth doing on the lines where you spend the most. See How Emissions Are Calculated for the full method.
Results are created as drafts. You can look them over on the dashboard.
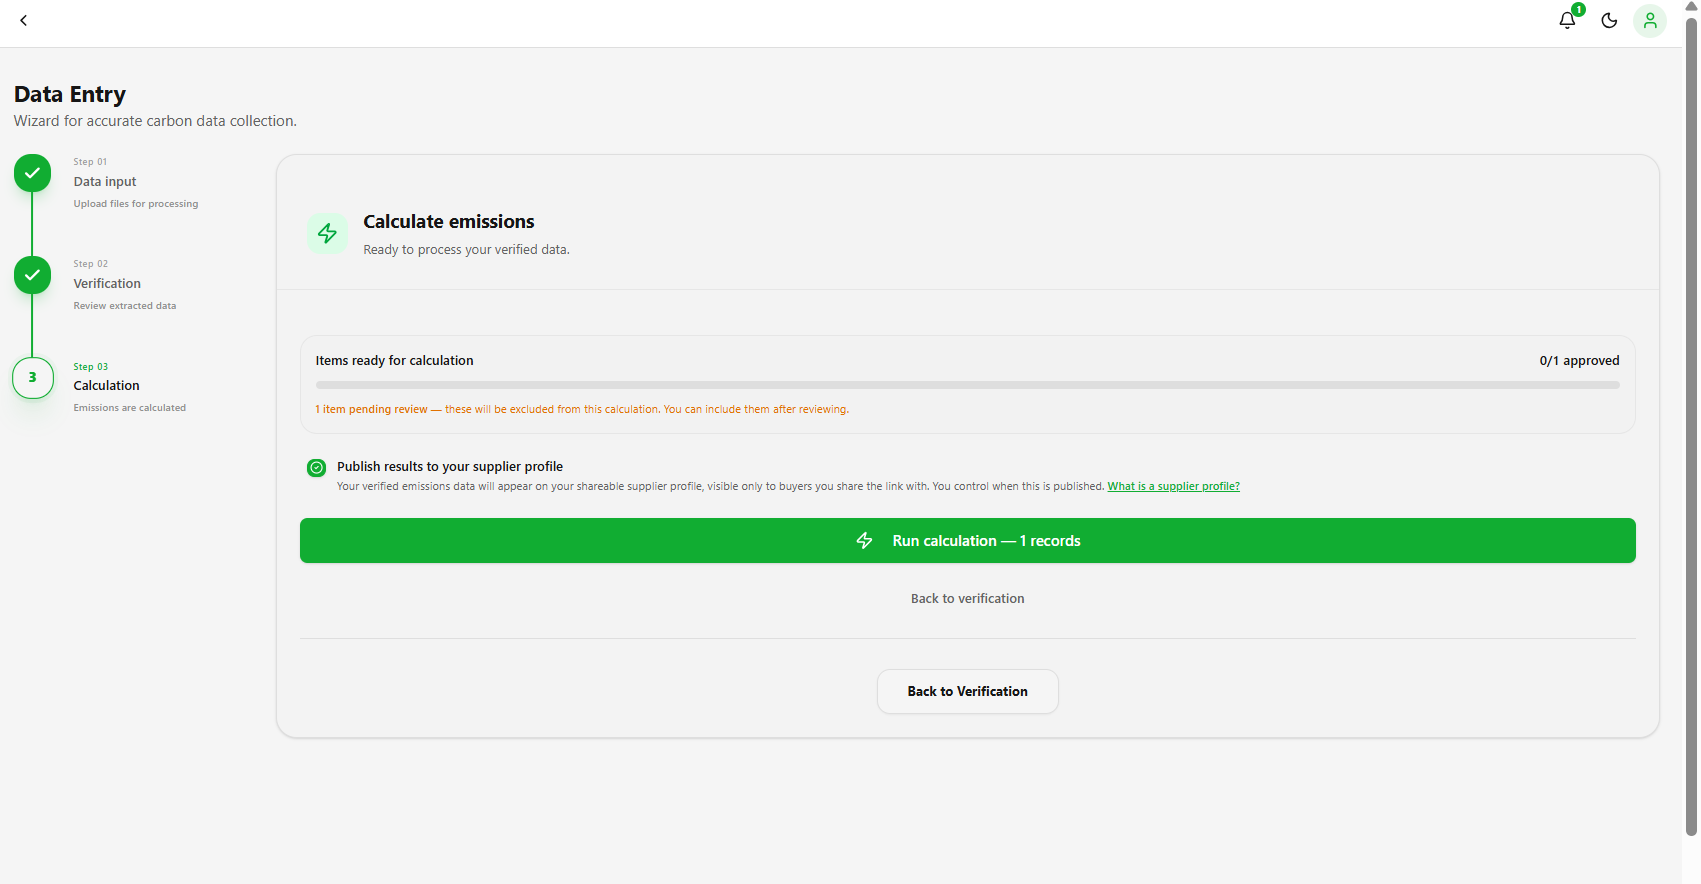
Step 1. Run the calculation. Once a line is approved it is ready to calculate. Items still pending review are shown and excluded from the run.
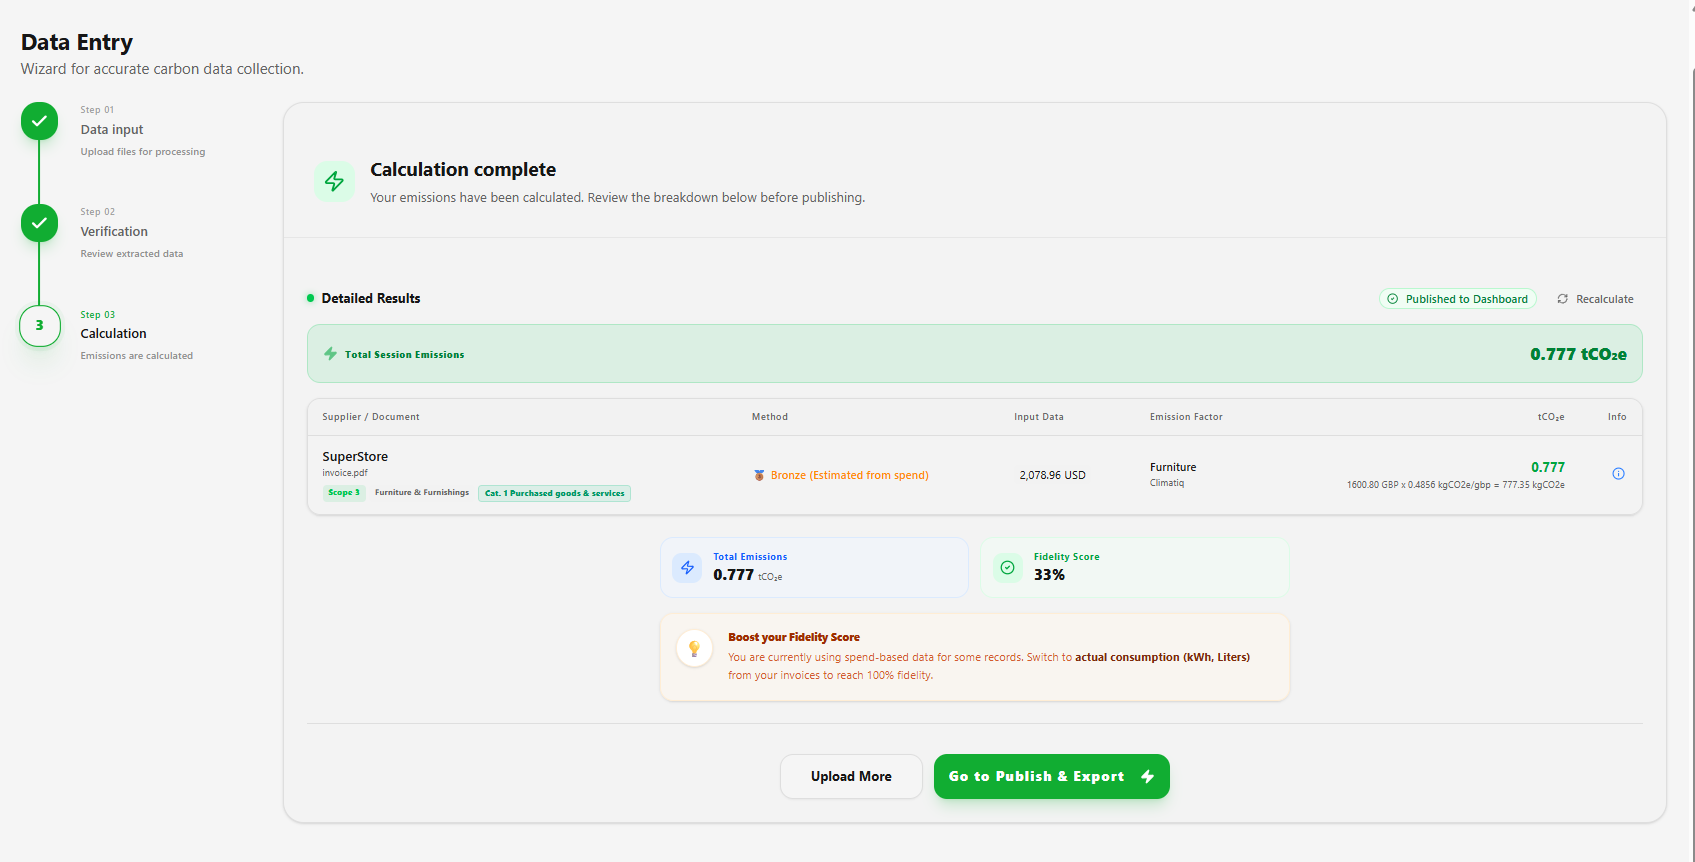
Step 2. Read the result. Continuing the SuperStore example: with only a spend amount and no quantity, it lands on Bronze. The method, the input, the emission factor and the full formula are all shown on the line, along with a fidelity score and a tip on how to improve it.
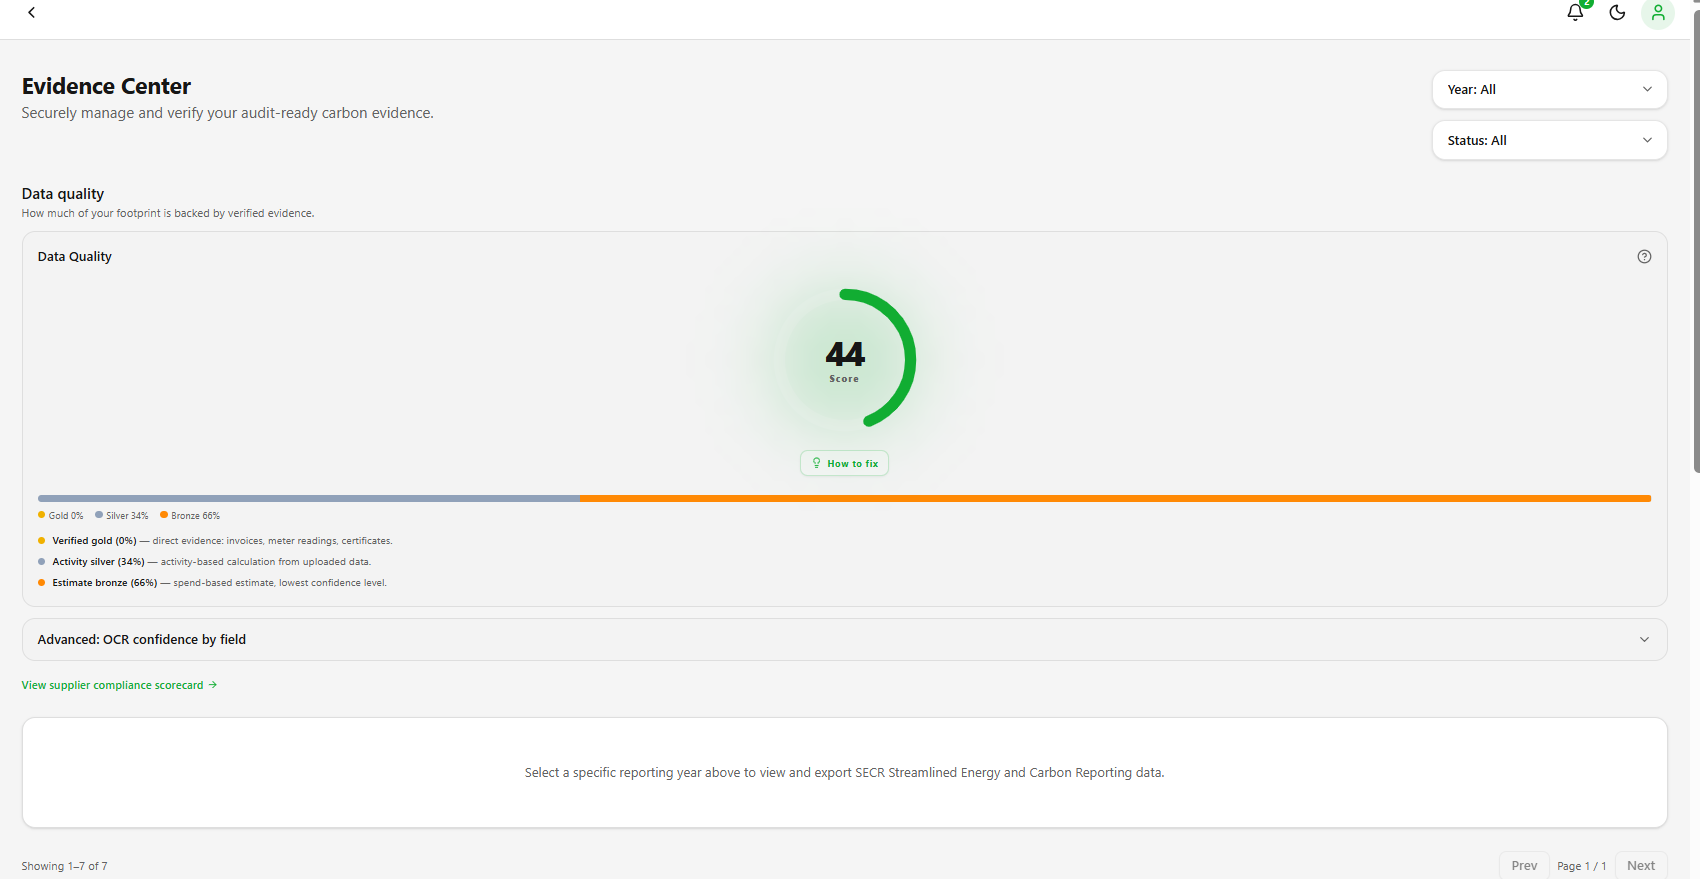
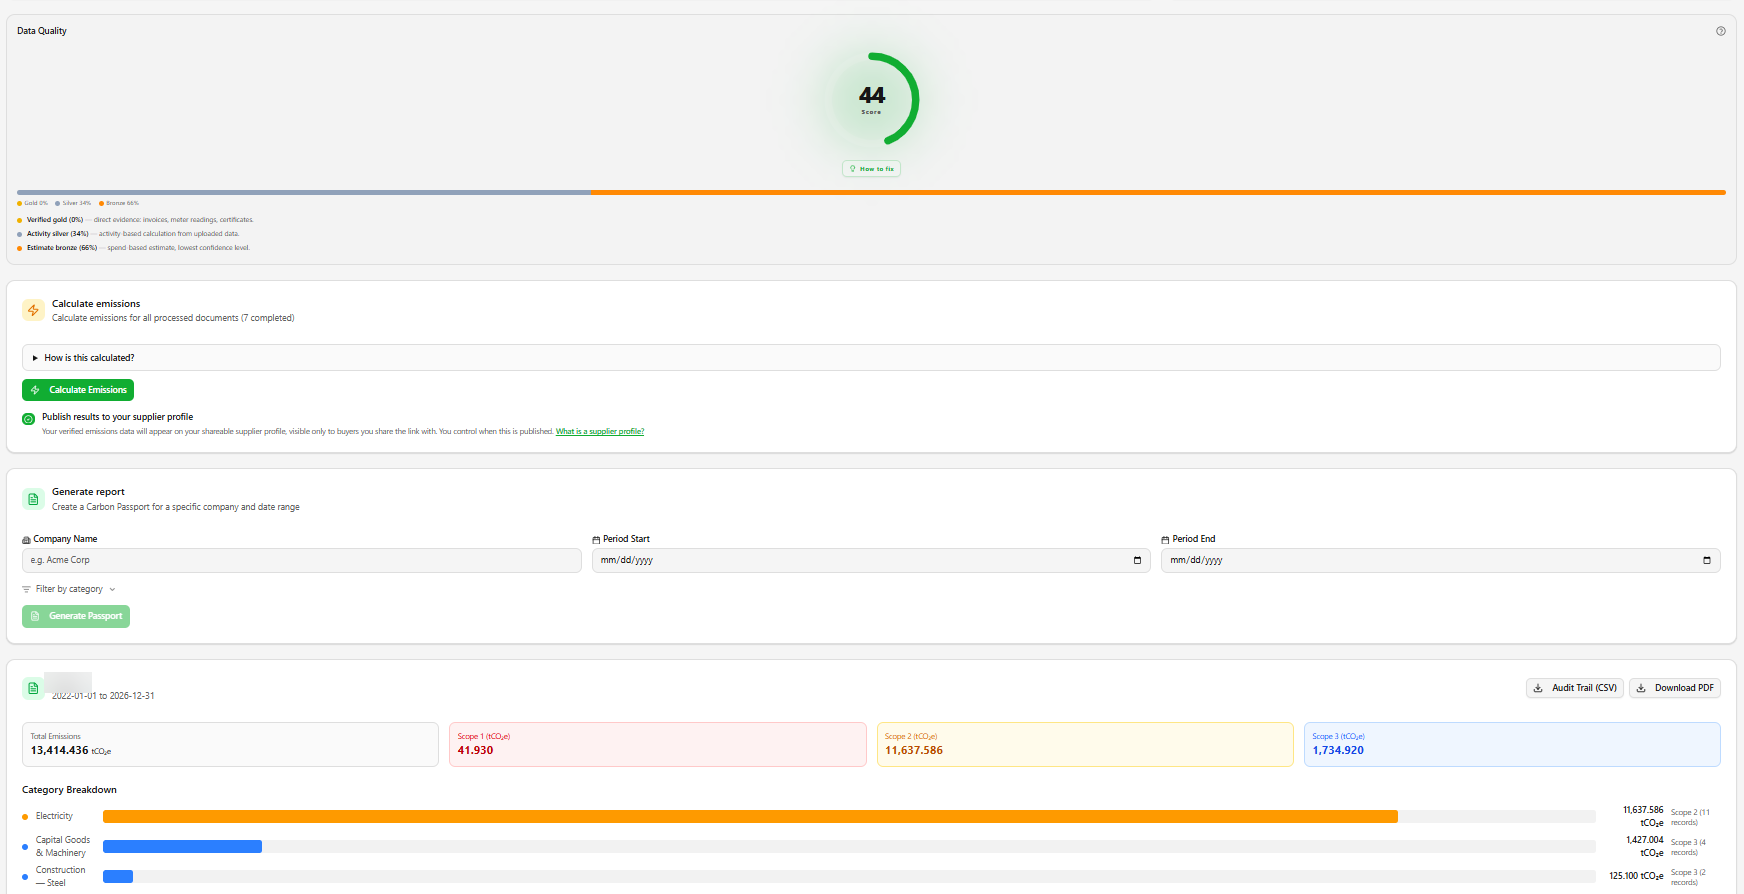
Step 3. Check your overall data quality. The Evidence Center shows the Gold, Silver and Bronze split across everything you have calculated, plus OCR confidence per field, so you can see at a glance where the estimates are.
6. Publish, and the Carbon Passport
New results are drafts and do not show up in your dashboard totals until you publish them.
A draft appears nowhere at all: not in your dashboard totals, not in your reports, and not on any link you have shared. Publishing is a deliberate action by someone with permission. That is on purpose — it stops half-checked data from moving a number that someone else is relying on. If your dashboard shows zero after a calculation, the usual reason is that everything is still a draft.
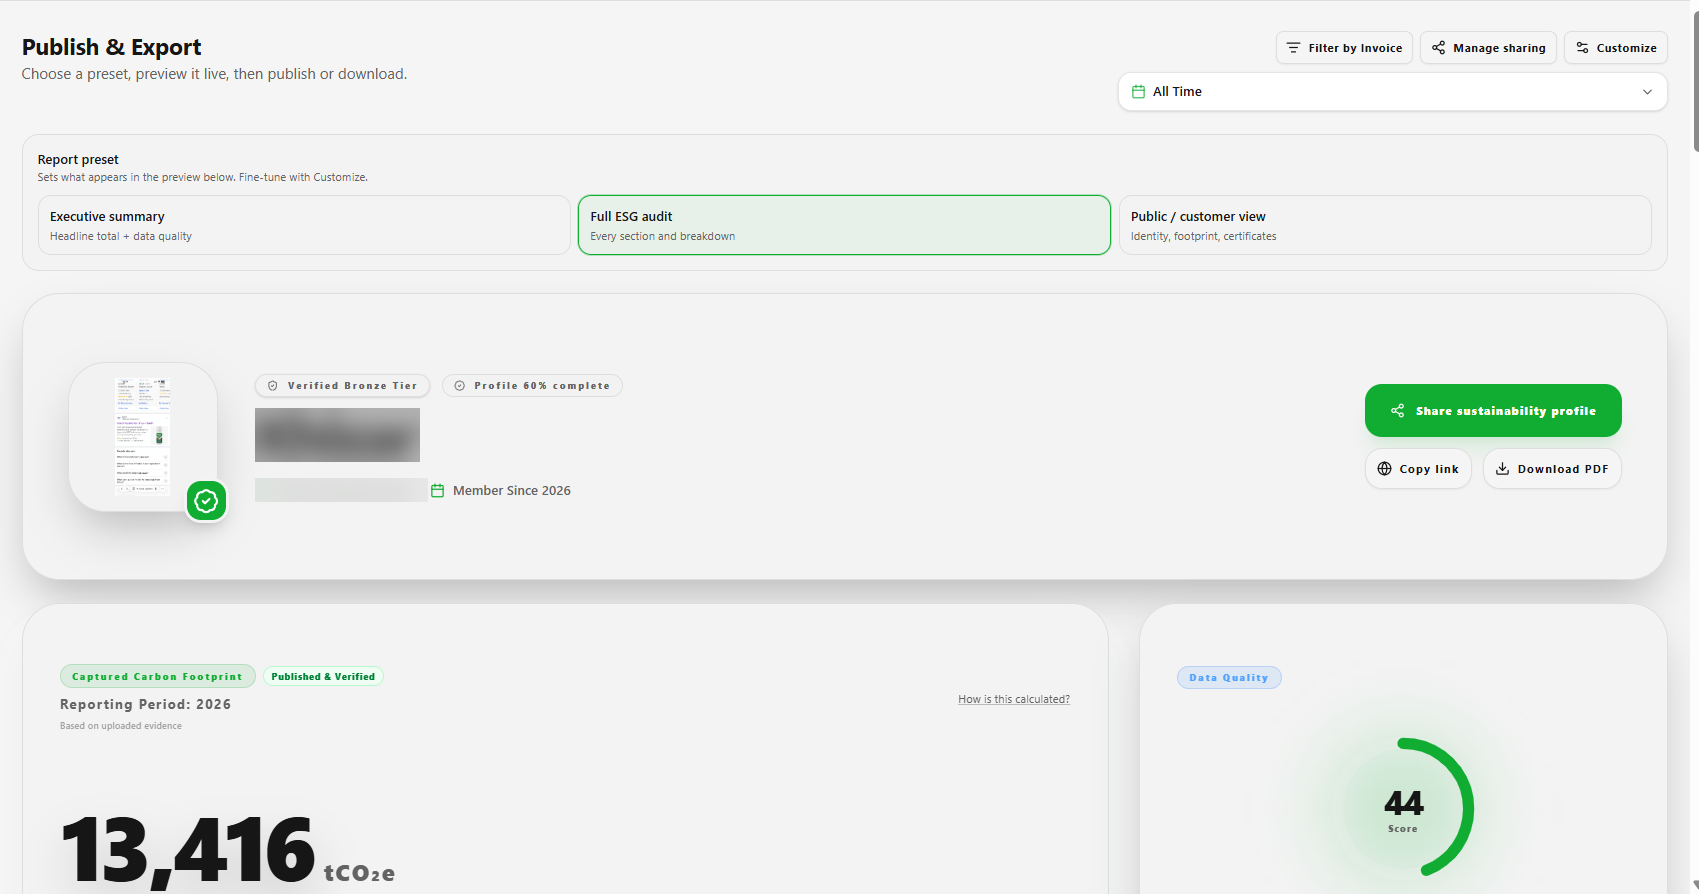
Step 1. Publish & Export. Pick a report preset — Executive summary, Full ESG audit, or Public / customer view — and it previews live before you publish or download anything.
6.1 What the Carbon Passport is
The Carbon Passport is the main thing this platform produces: a single report of your verified footprint that you can share, instead of filling in the same questionnaire over and over again. You will find it under Passport / Reports.
It breaks your emissions down into:
- Scope 1 — emissions from things you own or control directly.
- Scope 2 — emissions from the electricity you buy.
- Scope 3 — everything else in your supply chain, split into standard categories.
For Scope 3 we report Categories 1 to 7. Categories 8 to 15 sit outside what we currently report, and we say so openly in the report, so anyone reading it can see where the line was drawn rather than having to guess. The Scope 3 Category Map covers this, including how to ask us to look at it again if your business changes.
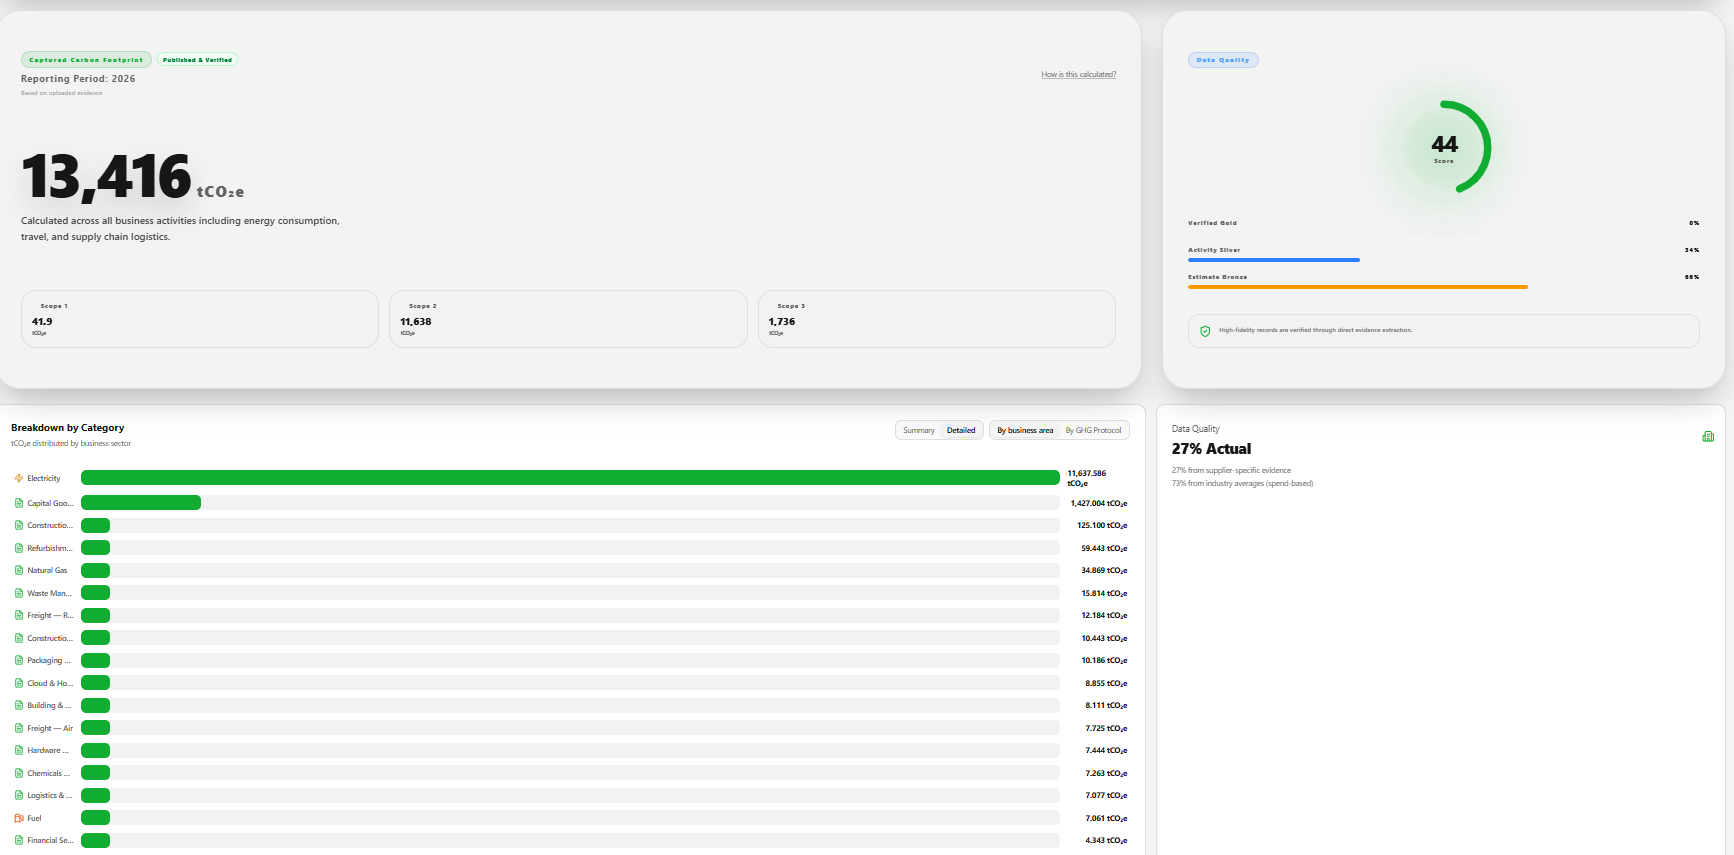
Step 2. Read the breakdown. The Scope 1, 2 and 3 totals sit above a category breakdown, so you can see straight away what is driving your footprint.
6.2 Exporting and sharing
- Download the PDF. A properly formatted report, suitable for management packs, board papers and auditors.
- Download the audit trail as a spreadsheet. Every line behind the totals, including which emission factor was used for each one.
- Share a secure link. Give clients, auditors or procurement teams a live view without having to set them up with an account. Sharing stays off until you switch it on, and you can switch it off again at any time.
Step 3. Generate a report for a specific period. Give it a company name and a date range, and it builds the passport for exactly that window, with the audit trail and PDF download sitting alongside it.
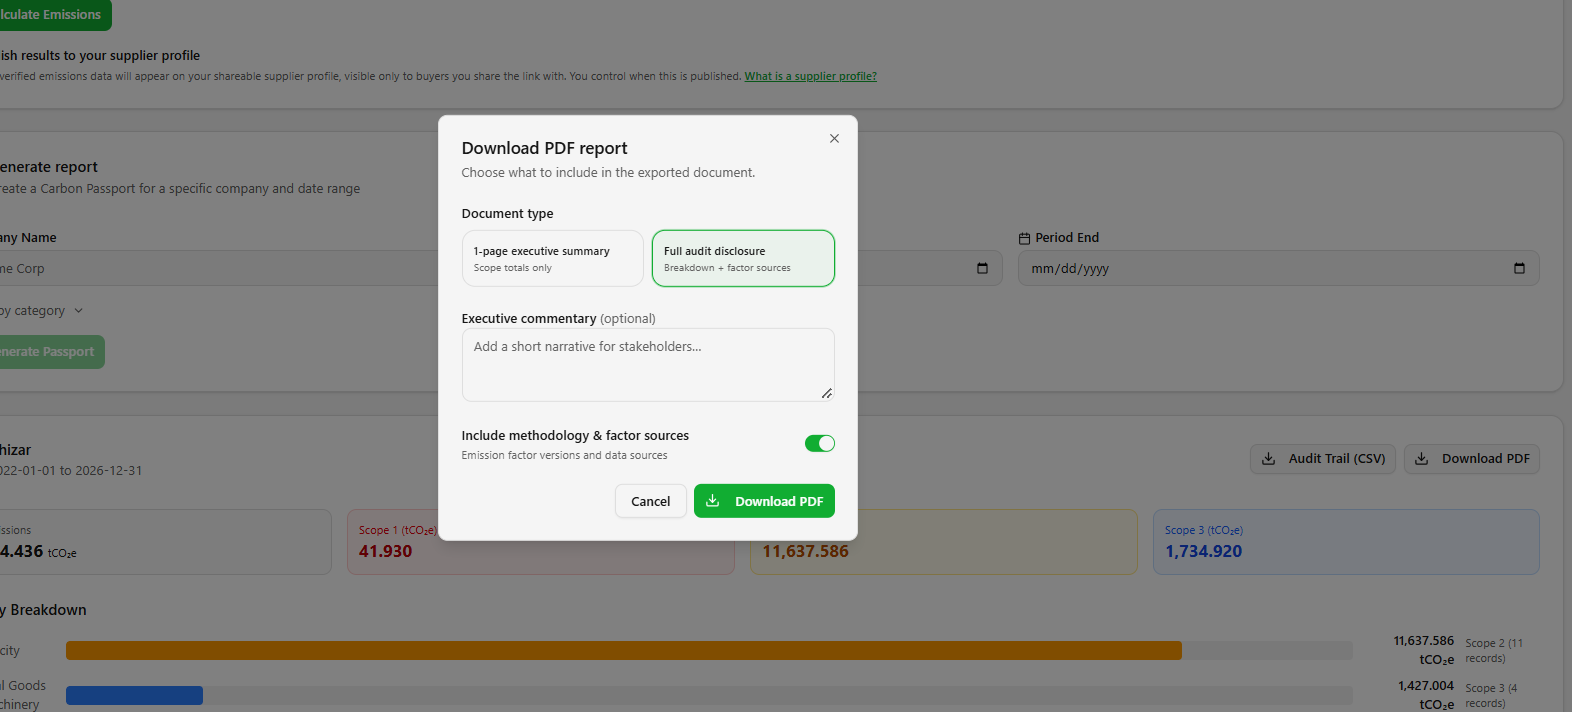
Step 4. Choose what the PDF includes. A one-page executive summary, or a full audit disclosure with the breakdown and factor sources. You can add a short commentary for stakeholders before downloading.
Assurance. These figures are suitable for management reporting and for estimating your footprint. Bronze figures are estimates. Reports are not SBTi-validated unless you have them separately assured.
7. Quick glossary
| Term | What it means |
|---|---|
| Line item | One row of spending or usage taken from a document. |
| Gold / Silver / Bronze | How good the data behind a figure is — the supplier's own number, actual usage, or the amount spent. |
| Draft vs Published | Only published results count towards your totals. |
| Publish gate | The rule that results count only once you have deliberately published them. |
| Scope 3 category | One of the 15 standard categories in the GHG Protocol. |
| Carbon Passport | The shareable report of your verified footprint. |
Stuck on an error message? The Error & Validation Guide lists every message, what causes it and how to fix it. For the calculation method itself, see How Emissions Are Calculated.